Cargando...
Recursos educativos
-
Nivel educativo
-
Competencias
-
Tipología
-
Idioma
-
Tipo de medio
-
Tipo de actividad
-
Destinatarios
-
Tipo de audiencia
-
Creador
Lo más buscado
- Dibujos colorear otoño
- Química elemental
- Repaso de griego
- Rhyming words
- Operaciones de multiplicar
- webquest
- Palabras con z
- Mujeres famosas de la historia
- Ahorro energético
- Actividades de lenguaje para primaria
- Aprender a reciclar
- Tintín
- actividades inglés
- Centenas, decenas y unidades
- Carga eléctrica
-

Answer. Factors for studying population (2)
EduBook Organización
- 1410 visitas
Draw a spider diagram to illustrate what factors affect population growth.
-

Final evaluation 06 - Living things
EduBook Organización
- 759 visitas
Draw a picture of a cell. Mark and name the important parts.
-

Let's learn how to... - The natural environment
EduBook Organización
- 2768 visitas
Draw a food web What do we do? You are going to draw the food web of the forest in the picture below. Draw the producers at the bottom of the food web. Then draw the primary consumers above, and finally…
-

Connected Mind
Héctor Espinoza Hernández Docente
- 1 lo usan
- 4995 visitas
Draw unique and memorable mind maps, store them in the cloud for free and access them anywhere
-

AutoDraw
Lizeth Yañez Rivas Docente
- 2 lo usan
- 1785 visitas
Fast drawing for everyone. AutoDraw pairs machine learning with drawings from talented artists to help you draw stuff fast.
-
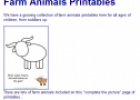
Farm animals printables
Tiching explorer Organización
- 2 lo usan
- 3021 visitas
This webpage contains a collection of printable worksheets (templates, story papers, learn how to draw, room decorations, etc.)
-

Final evaluation T15 10 - Art in the 20th century
EduBook Organización
- 2581 visitas
Draw a timeline and include the following artistic movements: Hyperrealism, Fauvism, Informalism, Expressionism, Transavantgarde, Dadaism, Surrealism, Cubism, Pop art.
-
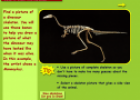
Drawing dinos
Tiching explorer Organización
- 1 lo usan
- 2619 visitas
Interactive resource designed to help us learn how to draw dinosaurs. It provides guidelines, tips and printable worksheets.
-
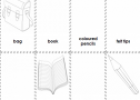
School objects
Tiching explorer Organización
- 1 lo usan
- 2739 visitas
Printable activity designed to help us revise names of school objects. We draw and colour the items.
-

Interpret. Legal immigrants in Spain.
EduBook Organización
- 2297 visitas
Compare this data with data from the previous graph and draw conclusions about the growth of the population.


Te estamos redirigiendo a la ficha del libro...
